
Ports and ocean carriers
Port import container volumes took a dive in the month of March. Many of the largest ports saw reductions of around 20% compared to the prior year. Those that fared better, with reductions in the 5 to 10% range, were Long Beach, Oakland, Baltimore and Virginia. On the export side, the performance worsened relative to February, with many ports down by 5 to 10% versus the year earlier. The Port of LA suffered the largest decline, at 23.8% versus the prior year. Long Beach, Baltimore and Virginia held on to positive comparisons versus March 2019.
Port loaded TEUs, Feb and Mar 2020: Change vs prior year, %
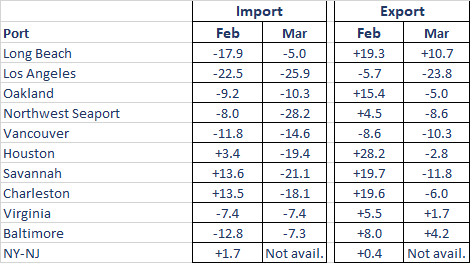
Source: Port websites, accessed May 1, 2020
The uncertainty around school reopenings in the fall has led retailers to be cautious in their merchandise orders. Ocean carriers have already canceled about 100 sailings to the US through mid-June, according to Sea-Intelligence Maritime Consulting. One commentator put this in stark perspective: On a worldwide basis, if blanked sailings were an entity, it would be the largest ocean carrier, by far, for these next weeks. Shippers should consider the capacity and lead time implications of blanked sailings by alliance when booking shipments. Freight rates have held up, which may signal a shift in pricing power towards the ocean carriers.
Ports expect May and June to continue weak. Port roles and relative positioning may change as shippers adjust supply chains and ocean carriers adjust services. Retailers and manufacturers are likely to source less from China and more from Southeast Asia, Latin America and Africa. This more distributed sourcing pattern could alter the paradigm of 12,000 TEU-plus vessels linking just a few North Asia gateways to a few large US ports.
And, as points of supply migrate south in Asia, US East Coast ports are positioned to gain share versus their West Coast competitors. But, while supply diversification might allow shippers to sleep easier, ocean carriers hurt by the plunge in volume and slower trade growth will seek to consolidate routes and port calls to manage costs. This financial necessity could lead to further growth at the current dominant ports in their regions, like Savannah. At the same time, less consolidated supply chains could provide opportunities for mid-market ports. For example, Wilmington NC has been investing in its reefer capacity, and has experienced strong volume increases in percentage terms during the past several years in refrigerated cargo, although the port still has some constraints on vessel size due to harbor depth.
Intermodal rail
The movement of containers by US railroads was down by 16.5% in the week ending April 25 versus the prior-year week. This extends a trend that began in April 2019, with the tariff wars and port coastal shifts. During the current pandemic, however, volumes have deepened their decline (see chart below). So far in April, units are down about 18%.
US intermodal rail trends, 2020 vs 2019 week
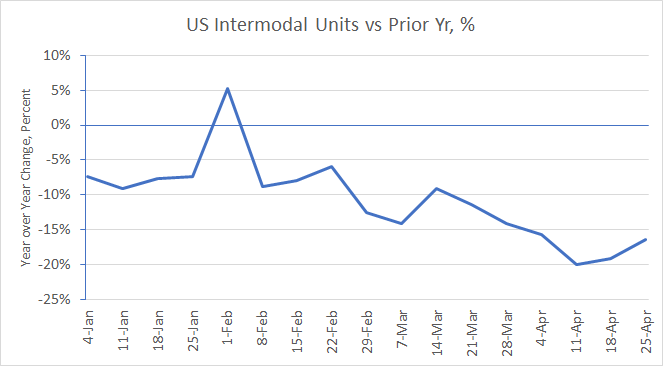
Source: AAR, Weekly Rail Traffic Data, Jan-Apr 2020.
It’s also sobering to look at carload traffic trends. US carloads of motor vehicles and parts, for example, are down by more than 80% in April to date, as factories have shut down in the US, Mexico and Canada. Railroads that reported Q1 earnings recently all expect weak volumes in Q2, with gradual improvement afterwards. Railroads have adjusted to the lower volumes by reducing train starts, which can affect service frequency – for example, instead of service every weekday, a customer might be cut to three deliveries per week. On the plus side, railroads have been able to improve intermodal train speeds.
Trucking
Trucking activity is down significantly but varies by region, service and truck type. Data developed by GeoTab, a Canadian telematics provider, reveals the decrease in equipment movements day-by-day over the mid-March to mid-April period.
By region, we see a deterioration of trip volumes during the week of April 13 versus the Feb 1-Mar 15 average as follows (approximate ranges):
- 40% decrease: New York/New Jersey
- 30% decrease: New England, Mid-Atlantic
- 20% decrease: South, Midwest, Southwest, Rocky Mountains, West
- 10% decrease: Central
By service type, the data show activity to grocery stores dropping the least over the period, down about 10%. Deliveries to warehouses are down about 15%, traffic to industrial facilities is down about 25% and activity into commercial locations is down about 30%.
By type of truck, heavy duty vehicles exhibit a decline in activity (relative to the Feb 1-Mar 15 baseline) of about 17% and light-duty trucks declining only about 13%, as of April 17. These figures are for North America as a whole.
Supply chain challenges
Shortages continue to be felt at US grocery stores. Categories facing the worst stockouts so far include cleaning supplies (Lysol, bleach, antibacterial wipes), paper products (toilet paper, paper towels) and baking supplies (flour, yeast, butter) as more people work from home.
Currently the spotlight has shifted to meat production. A number of plant closures have been announced recently in the Midwest and Pennsylvania. About 25% of pork plant capacity is currently down due to illness. We expect this to cause occasional shortages of meat in coming months. Some grocers are now pre-empting hoarding by limiting purchases.
Manufacturers are concentrating production on key items in order to raise productivity. Thus, selection is likely to be reduced for consumers. While demand is up for consumer basics, the destruction of demand in the food service channel has wreaked havoc at the farm level. Going forward, companies will need to pay greater attention to their supply chain risk and resilience.
Demand indicators
US GDP for the first quarter is down by 4.8%, according to the US Bureau of Economic Analysis advance estimate, as stay-at-home orders were issued in most states. This is the largest decline since late 2008. Personal consumption fell by 7.6%, the fastest decline since 1980.
US imports are also down sharply, by 11.4% in real terms in Q1 from the fourth quarter 2019. Exports were also down, by a narrower 1.2%. Trade data is expected to show sharper downward trends in April and the second quarter.
The good news
States are now beginning to transition out of the lockdown. Several states have announced partial lifting of measures, including Georgia, Texas, Florida, South Carolina, Oklahoma and Montana. Other states, however, have extended stay-at-home guidance: For example, New York until May 15 and Massachusetts until May 18. In California, the governor has issued six criteria for reopening but no date. A major concern for state officials across the country is ensuring that adequate testing and contact tracing capabilities are in place.
In addition, there has been some good news about a possible antiviral treatment and on progress toward a potential vaccine for COVID-19. A federal trial of treatment with remdesivir showed promising results that have left scientists “optimistic” and the FDA granted emergency approval on May 1st. In the UK, researchers at Oxford University have adapted vaccines originally developed for Ebola, MERS and malaria. Safety data from these earlier human trials may lead to accelerated trials of the vaccine. Still, effectiveness remains unproven – not to mention the challenge of producing these solutions in high volumes.
Longer-term implications
We see at least five major supply chain trends enduring beyond the pandemic:
- De-risking the supply chain. Companies will focus on risk assessment, greater localization, more inventory and better sensing and control tools. The balance will shift toward ‘just in case’ from ‘just in time.’
- Online ordering for home delivery. Only 2% of groceries were ordered online in 2019. With the coronavirus lockdowns, this share will skyrocket as consumers in all age groups and parts of the country develop a newfound mastery of the eGrocery channel.
- Growing small-scale and local solutions. Disruption of business as usual will be a boon to nimble, independent makers across the country. Whether selling face masks, fresh fish or wild mushrooms, small players will increasingly harness the internet and third-party delivery services to reach consumers directly.
- Automation at plants, stores and fulfillment centers. Automation will increase at US factories, particularly in food plants and others involving closely spaced workers. The rise of online orders and home delivery for food and other essentials will drive automation at grocery stores and in fulfillment centers.
- New business models. Nascent technologies, such as drones, self-driving vehicles and 3D manufacturing will get a giant boost from the pandemic experience. The need for continued social distancing will likely drive supply chain innovations in new and unexpected ways.
* * * * *
Contact us to explore how we can support your strategic, operational and investment needs: info@newharborllc.com.
David Bovet is the Managing Partner at New Harbor Consultants. He focuses on helping clients translate their supply chain vision into practical results. David brings 30 years of experience across a range of industries and geographies. Projects focus on strategic direction, market positioning, operational improvement and hands-on implementation.