Manufacturing in Mexico to supply the U.S. market remains robust. Mexico offers lower unit production costs compared to both the U.S. and China and has strong logistical and global trade advantages that make it an attractive locale to open or expand production facilities supplying the U.S., the Americas, and the world. Despite these facts, several myths have emerged over the years, which serve to obscure the continuing progress of Mexican manufacturing. Four of these myths are debunked here.
Myth 1: Mexico is losing out to a resurgence of U.S. manufacturing “reshoring”
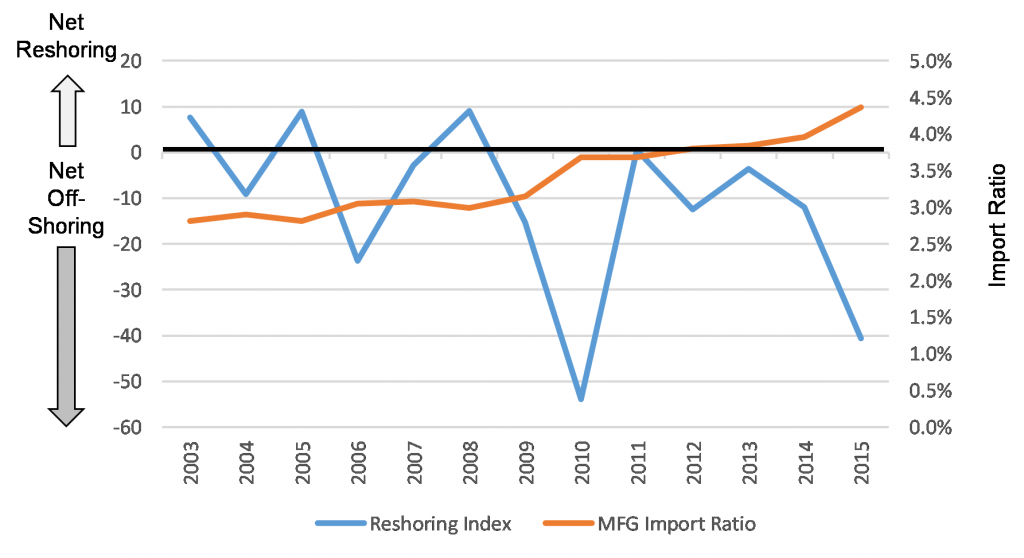
The reality is that Mexican-made products continue to gain ground in the U.S. market. This trend is revealed by applying the Reshoring Index and Import Ratio1 to manufactured goods imports from Mexico (Figure 1). There has been a consistent trend of net offshoring to Mexico (blue line below), over the past dozen years, and a corresponding rise in U.S. imports from Mexico relative to U.S. domestic output (from 2.8% to 4.4%, over 2003-2015; orange line below). As noted in a related New Harbor Consultants Brief, “Reshoring vs. Offshoring: The Exchange Rate Effect,” there is also a similar continuation of net offshoring of U.S. manufacturing to Asia.
Figure 1. U.S. Reshoring Index trend
Source: U.S. Census, U.S. Department of Commerce Bureau of Economic Analysis and New Harbor Consultants.
Mexico continues to benefit from its close proximity to the U.S. and from NAFTA, along with other free trade agreements spanning a total of 45 countries and almost 60% of the world GDP. Hence, Mexico remains an attractive production base for U.S. and global companies to supply U.S. and Mexican markets, as well for export globally. This advantage has been especially notable for automobile and electronic manufacturers. In recent years, Audi, BMW, Fiat, Ford, GM, Kia, Nissan, Toyota, and VW have all announced or opened new plants or major expansions in Mexico, often at the expense of U.S. investments. Leading contract manufacturer Flex increased Mexico’s share of its global net property and equipment by 3 percentage points, from FY14 to FY15, while reducing China’s share by 4 points and the U.S. share by one point.
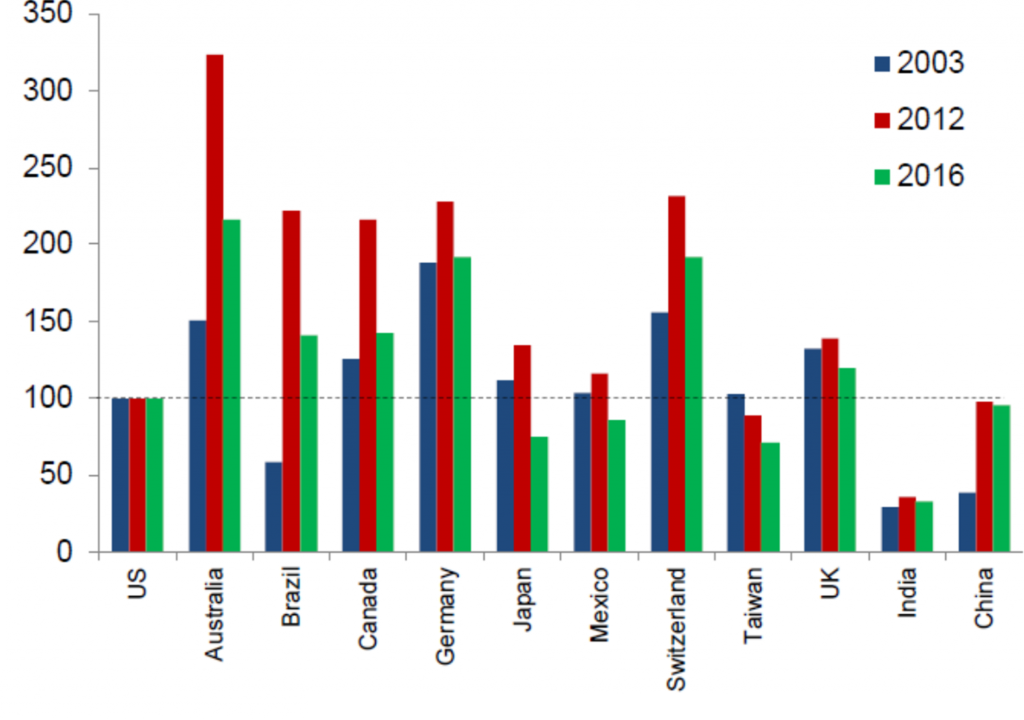
Mexico’s attractiveness as a production base rests on underlying labor cost and productivity advantages. These have improved recently relative to the U.S., particularly since 2012, according to research by Oxford Economics. The current (2016) situation is a sharp reversal from 2003, when Chinese unit labor costs were less than half the U.S. level and Mexican costs were on par with the U.S. The availability of highly skilled labor in Mexico is an advantage cited by manufacturers.
Figure 2. Unit Labor Costs (U.S. = 100)
Source: Oxford Economics, 2016.
Myth 2: Mexico is falling further behind China as a manufacturing base for U.S. markets
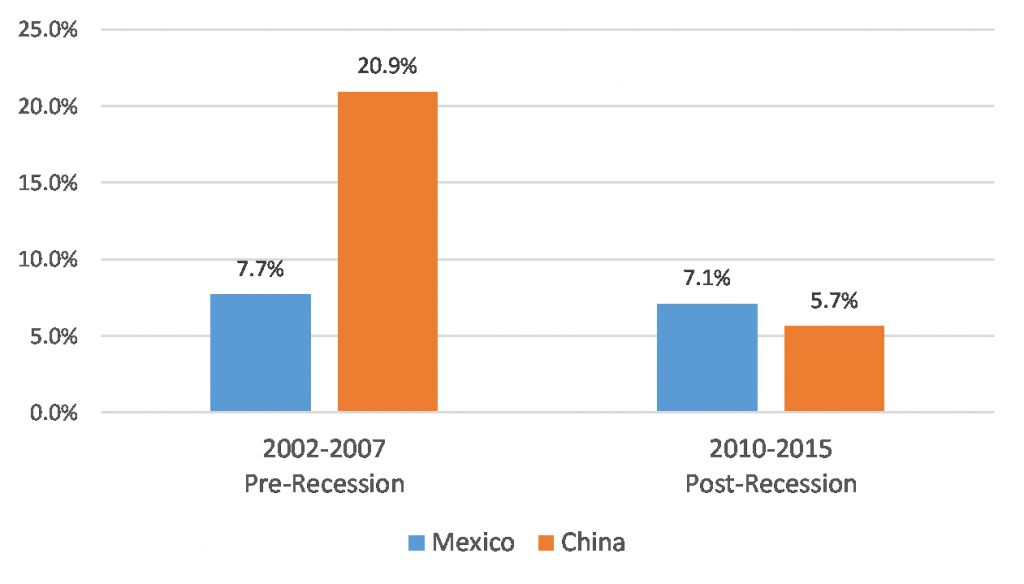
China still is the world’s largest exporter of manufactured goods to the U.S. However, since the end of the financial crisis, the growth rate of manufactured product imports from Mexico into the U.S. has exceeded that of imports from China (Figure 3). This is a sharp reversal from the pre-recession trend.
Mexico’s relative competitiveness with China, as a source for U.S. markets, has also received a boost from challenges in China. In recent years, China’s manufacturing wages have been rising absolutely and relative to increases in its productivity. Labor unrest has burst out across China, a phenomenon formerly unknown in the country. This has prompted shifts in manufacturing out of China to low-wage Southeast Asian nations and, for more sophisticated products, to Mexico (for further insights, see the New Harbor Consultants Brief, “Vietnam in the Trans-Pacific Partnership: Trip Report”).
While China and other Asian exporting countries are benefiting from the collapse in ocean freight rates, Mexico continues to maintain strong logistical advantages: Geographic proximity, shorter transit time, time zone alignment, accessibility, free trade, cross-border logistics investments (particularly in road and rail), and strong political and social ties with the U.S.
Even China-based manufacturers recognize Mexico’s comparative advantages. For example, Hisense, the world’s third-largest TV manufacturer in units, is growing its production capacity in Mexico to supply the North American market.
Figure 3. Chinese and Mexican Manufactured Goods Import Cumulative Annual Growth
Source : U.S. Census/Perspective60.
Myth 3: Cross-border logistics are stifling U.S. imports from Mexico
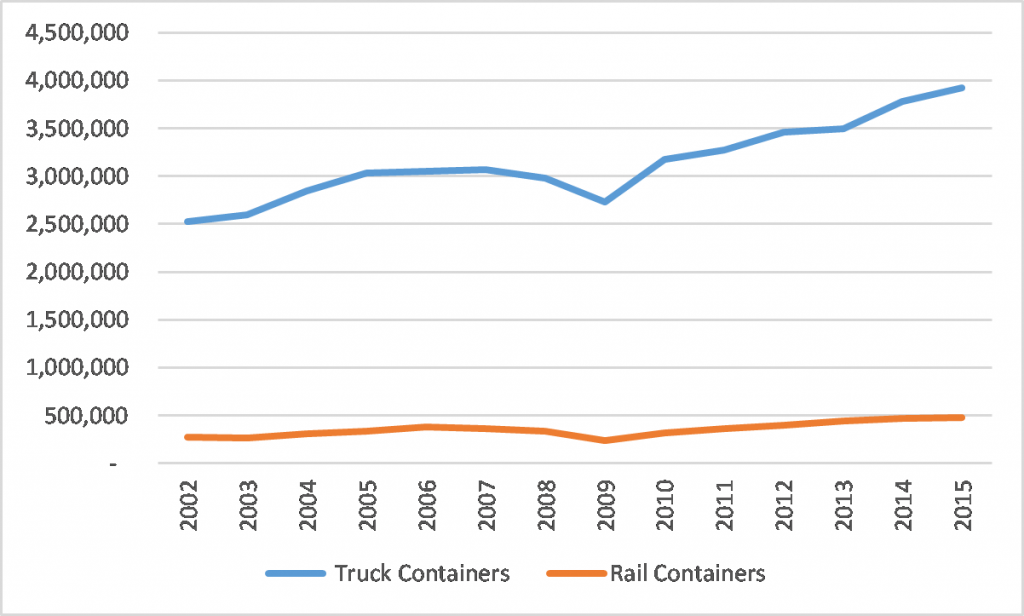
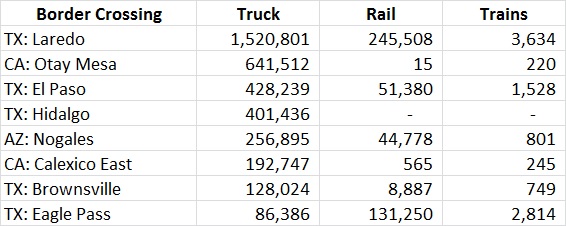
Although the majority of Mexican manufactured goods imports arrive in the U.S. via truck, intermodal rail volumes are growing rapidly (Figure 4). Between 2010 and 2015, rail container imports from Mexico have grown on average by 8.7% per year, more than twice the rate of truck (4.3% per year) flows. Intermodal’s share has increased from 9% to 11% of combined truck plus rail container import volumes, from 2010 to 2015. Rail is particularly active at the Laredo, Eagle Pass and El Paso crossings in Texas (Figure 5).
Figure 4. Mexico to U.S. (Northbound) Freight Border Crossings
Source: U.S. Department of Transportation, Bureau of Transportation Statistics.
Figure 5. Largest Mexico-U.S. Northbound Border Crossings in 2015
(Truck and rail containers, number of trains)
Source: U.S. Department of Transportation, Bureau of Transportation Statistics.
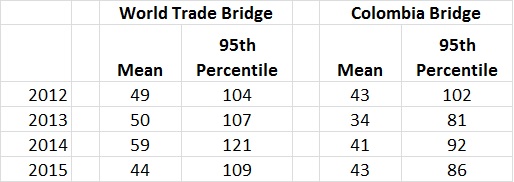
While there can be substantial northbound vehicle congestion, border crossing times for commercial trucks average less than one hour at the two Laredo bridges (Figure 6), the largest port of entry. Moreover, truckers can proactively schedule crossings to coincide with low or no-wait time periods by utilizing historical data and consulting the hourly updates on the CBP Border Wait Times website.
Compare this to port truck visit times (queuing and in terminal) of 100 minutes or more at the Ports of Los Angeles and Long Beach, or to weeks in transit for imports from Asia. Indeed, companies shifting production to Mexico often cite the benefit of reduced cycle times as part of their decision. For example, United Technologies recently noted that a shift to Mexico manufacturing would bring it closer to its key customers and its supplier base which has also migrated to Mexico.
Figure 6. Commercial Vehicle Border Crossing Times at Laredo, TX (minutes)
Source: Border Crossing Information Systems, Texas A&M Transportation Institute, The Texas A&M University System.
Myth 4: Cargo theft and drug-linked crime are show-stoppers for increased nearshoring to Mexico
Mexico’s cargo theft and crime problems remain top concerns for U.S. companies relocating production to Mexico. The “severe” nature of the cargo theft problem, as assessed by FreightWatch International, warrants significant precautions and public-private engagement to protect personnel and products. However, these issues (which have not prevented accelerated nearshoring to Mexico) seem to represent potholes along the road to further Mexican manufacturing growth, rather than roadblocks.
An estimated 5,000 cargo theft incidents occur each year in Mexico. In 2015, cargo theft losses totaled about $950 million, excluding the consequential human impact (most thefts involving hijackings) and the customer service and related financial losses that ripple through the supply chain resulting from each occurrence. But relative to the size of the Mexican economy ($1.3 trillion) and its global trade (imports plus exports of $776B) in 2015, this risk is not a show-stopper.
Cargo theft can be mitigated by adopting a range of security practices, such as: Traveling on main highways and toll roads, convoying, real-time vehicle tracking and monitoring, motorized escorts, driver and helper background checks, security protocol compliance audits and training, and truck protection measures (e.g., GPS, sensors, panic button).
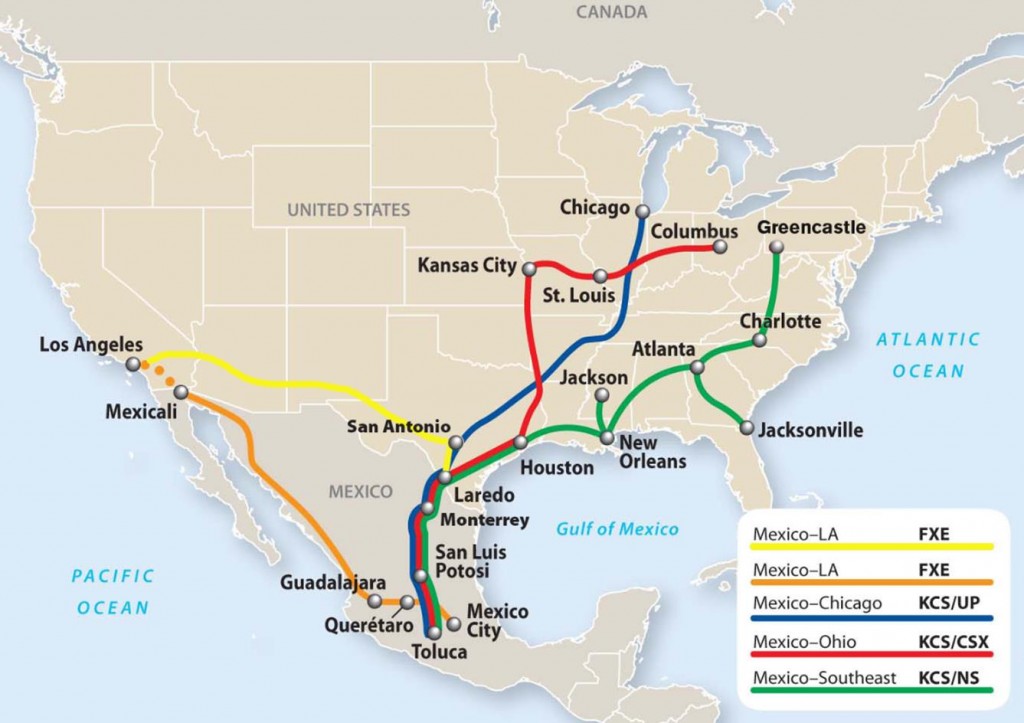
While rail traffic is not free from theft, its loss risk profile is lower than with truck cargo. Rail intermodal services into the U.S. from Mexico have improved and have become more attractive from both service and cost perspectives. While truck transit times from Mexican manufacturing zones to destinations in the U.S., even with the border congestion and dray delays, are often shorter than intermodal, there can be considerable cost and cargo security advantages to using intermodal services for imports from Mexico (Figure 7).
Figure 7. Primary Mexico-U.S. Cross-border Rail Corridors and Carriers
Source: APL Logistics.
For example, electronics goods routed intermodally from Monterrey, Mexico, to Los Angeles or Charlotte can garner substantial costs savings, although with longer transit times (Figure 8).
Figure 8. Comparison of Over-the-road and Intermodal Northbound Routings
Source: APL Logistics and New Harbor Consultants.
Intermodal also offers an improvement in security compared to over-the-road truck: Limited stoppages en route and at the border, with double stacking as further theft deterrent. This helps to explain the strong growth in intermodal volumes mentioned earlier.
Global Manufacturing Strategy
In light of the reality rather than the myths, nearshoring of manufacturing to Mexico will likely remain competitively attractive to U.S. manufacturers and other multinationals. Assessing how Mexico might fit into a company’s regional or global manufacturing strategy requires an approach that integrates considerations of cost, service, risk, and social responsibility. These factors vary by industry and company, and across different locales in Mexico. And as in the U.S., Mexican state and local governments may offer substantial incentives to locate or expand in their jurisdictions. Hence, it pays to ignore the myths, get the facts and do the analysis when it comes to manufacturing in Mexico.
Endnotes:
1 Calculations by New Harbor Consultants, applying the A.T. Kearney definitions of Import Ratio and Reshoring Index. The manufacturing import ratio is calculated by dividing the manufactured goods imports from Mexico by the U.S. gross domestic output of manufactured goods. The U.S. Reshoring Index is the year-over-year change in the manufacturing import ratio, expressed in basis points.
Contact us to explore how we can support your strategic, operational, and investment needs: info@newharborllc.com
Dave Frentzel is a Partner at New Harbor Consultants. Dave combines his logistics and supply chain expertise with hands-on executive leadership experience to improve business outcomes. He has extensive global supply chain expertise having spent more than ten years living and working internationally helping companies improve their global go-to-market, sourcing, and supply chain strategies and operations. Dave’s experience spans a wide range of industries, working with companies in the after-market service, apparel, CPG, eCommerce, food & beverage, healthcare, hi-tech, and retailing industries.

