
Is there a nascent resurgence in manufacturing (a.k.a., ‘reshoring’) in the United States? Or will the offshoring trend of recent years continue? This question has taken on major political overtones in the current election year. The answer is significant for American workers – in factories and in distribution of foreign-made goods across the country – as well as for local suppliers and public finances. It is thus a topic worthy of analysis.
The globalization of manufacturing
Rising imports replacing US domestic production of manufactured goods is a theme common to most of US post-World War II history. Cheap output of consumer items first appeared in this country from Japan and Western European countries devastated by the war. The low-cost nexus of global manufacturing then shifted over time, so that by the nineties China was firmly established as the world’s manufacturing hub. In recent years, while China remains dominant, manufactured imports by the US have grown more rapidly from other Asian sources, notably Vietnam, Thailand and Indonesia.
From a trade and logistics perspective, these trends are readily observed in data on containerized cargo entering the US. Over the past dozen years, the rise in Chinese containerized (largely manufactured) shipments to the US has been spectacular: From 29M (2003) to 57M tons (2015) (Figure 1).
Figure 1. US containerized imports from Asia, million metric tons
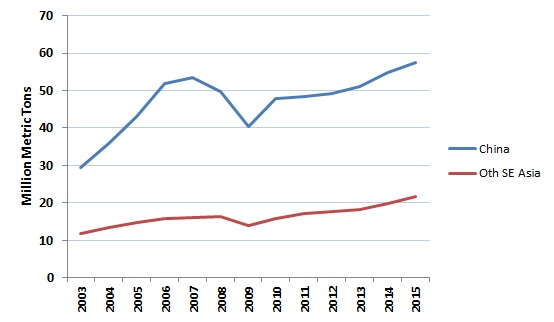
Source: United States Census Bureau, http://usatrade.census.gov/Perspective60.
This works out to a compound annual growth rate of 5.7% per year, more than triple the 1.8% annual rate of growth of real GDP in the United States. Imports from other Asian low-cost nations1 have also expanded rapidly during the past dozen years, as shown in Figure 1 (compound annual growth rate of 5.1%). These countries (we include Bangladesh, Cambodia, India, Indonesia, Malaysia, Pakistan, Philippines, Sri Lanka, Thailand and Vietnam) have successfully developed their manufacturing capabilities and quality, their local supply bases and logistics infrastructure – and have benefited from fast electronic communications and cheap international transportation. Tariff barriers have fallen; China was admitted to the World Trade Organization in 2001 and Vietnam in 2007. In the case of Vietnam and several other Southeast Asian nations, recovery from war and strife has also aided export success.
In a broad sense, expansion of manufactured exports from Asia to the US simply reflects – and has contributed to – the rising of these economies toward the levels long experienced in the developed Western world. Gross domestic product (GDP) per capita in China has grown at six times the rate in the United States, during the 2003-2014 period (Figure 2). Hundreds of millions, if not billions, of people have seen their living standards improve markedly.
Figure 2. GDP per capita trends, in current $ terms
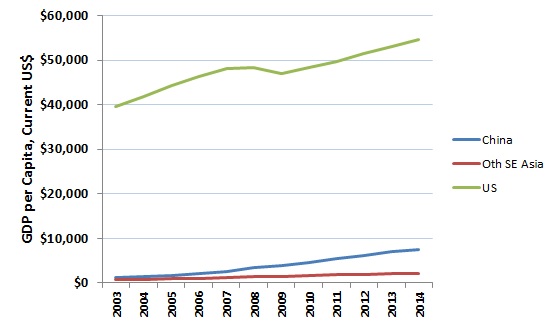
Source: World Bank, World Development Indicators, GDP at market prices (current US$); Population, total
http://data.worldbank.org/indicator/NY.GDP.MKTP.CD/ http://data.worldbank.org/indicator/SP.POP.TOTL
Note: 2014 is most recent year available
With the dramatic reduction in barriers to trade, transport, communications, capital and education experienced over this timeframe, it is not surprising that global manufacturing production has sought a new equilibrium. This new world (famously labeled ‘flat’ by economist Thomas Friedman in 2005) has wrought revolutionary economic changes in the developing world. Living standards have soared for China and other Asian nations, both absolutely and as a percentage of the US economic level. Overall, however, China and other low-cost Asian nations still provide far lower living standards. GDP per capita in China, for instance, reached only 14% of the US level by 2014.
Meanwhile, globalization and accompanying offshoring has contributed to the ‘hollowing out’ of the US manufacturing base. Global trade benefits US consumers as a whole but the brunt of the downside is borne by manufacturing workers whose jobs and incomes are lost. Since 2003, manufacturing jobs in the United States have declined at a compound annual rate of 1.4% (Figure 3). The Great Recession of 2008-09 resulted in a dramatic drop in industrial employment. In the succeeding six years, less than 800,000 manufacturing jobs have been recouped.
Figure 3. US manufacturing employment, millions
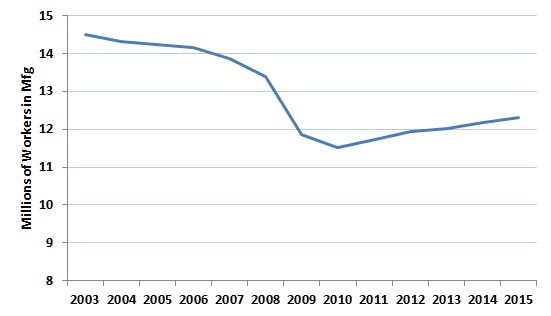
Source: Bureau of Labor Statistics, Industries at a Glance: Manufacturing: NAICS 31-33
http://www.bls.gov/iag/tgs/iag31-33.htm
Offshoring and reshoring
Offshoring has affected many segments of the US manufacturing industry. Clear examples are found in textiles and apparel, for example, and in consumer electronics. Major US apparel makers and retailers, such as Hanes, the Limited and the Gap shifted their US production or sourcing to the Caribbean Basin and China; more recently to Bangladesh and Vietnam. Global companies, such as Hong Kong-based Li & Fung, arose to orchestrate the multinational production, assembly and distribution of clothing. The shift is so complete that the success of a US-based garment maker (such as American Apparel in Los Angeles or trendy sock maker Emi-G Knitting in Alabama) is newsworthy. Laptop computers and mobile phones sold under US labels such as IBM (until 2005), Dell and Apple switched to Asian production years ago, in their own Chinese plants (Dell), through sale to Chinese maker Lenovo (IBM) or via a Taiwanese contract manufacturer (Foxconn, for Apple).
In other cases, including automobiles, shipbuilding, and steel, manufacturing has shifted to Asia as Asian companies have successfully entered the US market with their products. This is not offshoring per se, but the trade and jobs effects are similar, just not as directly traceable.
- Automobiles: First Japan, then Korea, and now China is beginning to eye the US market – despite a significant rise in US-based but Asian- and European-owned plants.
- Shipbuilding: US shipyards, which produced thousands of merchant ships during and after World War II in cities such as Boston, Philadelphia and Baltimore, have long been supplanted by Japanese and European yards, then by China and Korea.
- Steel: Mills in China, Korea, Brazil and elsewhere have been supplying US markets for decades. There are currently at least 17 trade remedy cases underway, dealing with anti-dumping and countervailing duties on steel imports.
Foreign direct investment has been a major factor in these trends, complementing domestic capital formation in developing nations. The sheer volume of these investments is staggering: China alone received $289 billion in direct foreign investment in 2014, according to The World Bank (Figure 4).
Figure 4. Foreign direct investment in Asia, $ billions
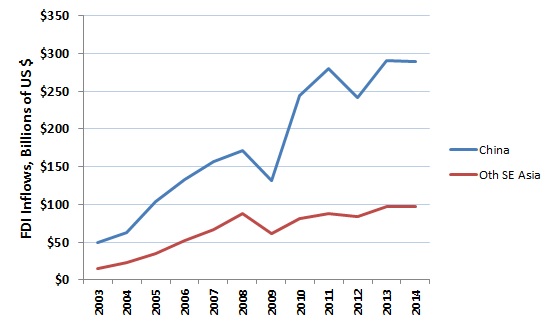
Source: World Bank, World Development Indicators, Foreign direct investment, net inflows (BoP, current US$)
http://data.worldbank.org/indicator/BX.KLT.DINV.CD.WD
Note: 2014 is most recent year available
Much of this funding has come from the United States and other wealthy nations such as Europe and Japan. Investment has also flowed, in recent years, to Vietnam, Indonesia and other low-cost Asian nations – totaling $97 billion in 2014.
Enter, over the past few years, the ‘new’ concept of reshoring. This is the term bestowed on the trend of bringing back to the US manufacturing operations previously offshored to Asia. Several examples have been widely cited:
- President Obama visited a Master Lock plant in Milwaukee, in February 2012, which had reshored about 100 jobs from China.
- Starbucks opened a processing plant for ceramic mugs in Georgia and reopened a plant in Ohio.
- Caterpillar, General Electric, Ford and Otis Elevator have also reported reshoring manufacturing jobs to the US.
- Others have announced ‘Buy American’ plans which, though not directly involving reshoring, work towards the same aim of preserving American factory jobs. Walmart committed to buy an additional $250 billion in US-made products over a ten-year period (beginning January 2013).
The question is, can we consider reshoring to be the wave of the future, or will offshoring remain the norm? The answer will directly impact manufacturing and logistics jobs in the US, the cost and availability of consumer goods, and public finances at all levels.
Measuring offshoring and reshoring
Measurement of the offshoring trend and its flip side, reshoring, is essential to a factual discussion of the phenomenon. Consultants at A.T. Kearney tackled this challenge in 2014 by creating a US Reshoring Index. The firm’s latest analysis appears in a white paper released in January 2016.2 The report concludes that “reshoring as a ‘trend’ is officially dead, at least for now.”
The A.T. Kearney index is constructed as follows: It is the annual change in the ratio of the value of manufactured goods imports from 14 Asian trading partners3 to the US domestic gross output of these products, expressed as basis points. The index moves positively when imports fall relative to US production and negatively when the import ratio rises. It is thus a broader measure of US manufacturing competitiveness than just offshoring/reshoring, for it captures the balance of imports to domestic production regardless of whether the imported product was formerly produced in the US or not. The index is also focused on products rather than jobs, so it avoids the pitfall of attributing US job losses only to offshoring, when many workers have succumbed to automation instead.
This index has generally remained in negative territory – that is, indicating net offshoring – over the past dozen years, with notable bright spots in 2008 and 2011 before plummeting in 2015 (Figure 5). This is despite the well-publicized (but isolated) cases of reshoring in the electrical, transportation, apparel, electronics and other manufacturing industries. And the trend has persisted despite a variety of logical reasons that could potentially favor the US, ranging from delivery time improvement or customer responsiveness to quality gains, the Made in USA image, freight costs and even wage cost trends. As an aside, we were recently surprised to learn that a US garment maker faces longer lead times from a US fabric supplier than from an Asian source, despite the several weeks required for ocean transportation. The A.T. Kearney consultants attribute the strong offshoring trend to lackluster US domestic manufacturing growth and the strength of offshore manufacturing.
Figure 5. US Reshoring Index trend
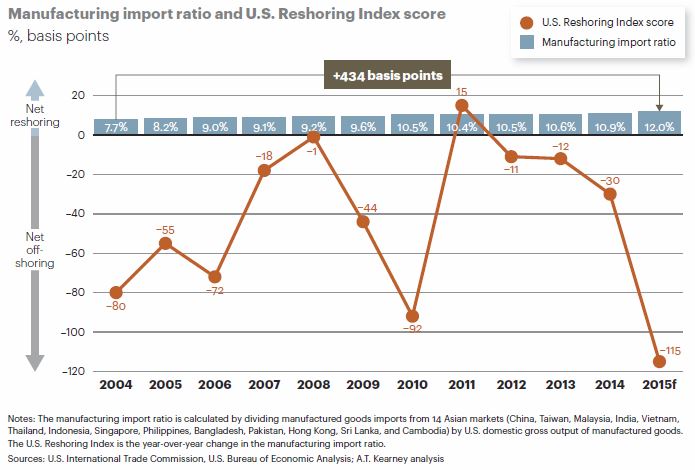
Source: A.T. Kearney, U.S. Reshoring: Over Before It Began?, Jan 2016, p 2.
Drivers of offshoring and reshoring
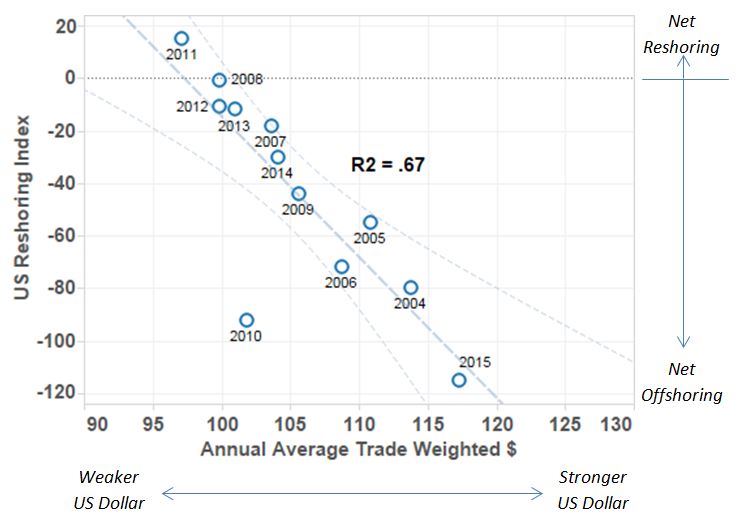
A search for the deeper causes of the offshoring/reshoring phenomenon led us to examine several potential independent macroeconomic factors. What we found was not unexpected but surprisingly robust in its explanatory power. We regressed the US Reshoring Index against the trade-weighted US dollar index, a broad measure of strength of the US dollar (from Federal Reserve data).
This single independent variable yielded a correlation coefficient (R2) of 67% (Figure 6). In other words, a strong US dollar (against weak foreign currencies) essentially drives manufacturing abroad, where it seeks favorable conditions that are currently found in China and other Asian developing countries. In simple terms, when other currencies are weak versus the dollar, it is cheaper to source in those countries than to manufacture in the United States.
Adding the rate of real US GDP growth as a second independent variable raises the R2 value to 90%. This is because economic growth (largely fueled by consumers, in the US economy) drives the demand for production. When combined with a strong dollar, this additional demand is met by output that flows into the US from overseas. Thus, all the other many factors cited in discussions of this major economic and business phenomenon are just noise around the key macro drivers: If the dollar is strong and the US economy is growing, the stars are aligned to suck massive amounts of manufactured imports into the country, and any reshoring that takes place will be dwarfed in comparison.
Figure 6. US Reshoring Index as a function of trade-weighted US$ index
Sources: Trade weighted US Dollar Index: St Louis Fed: https://research.stlouisfed.org/fred2/series/TWEXB#
US Reshoring Index score, A.T. Kearney: US Reshoring: Over Before It Began?, Jan 2016. Index is year-over-year change in the manufacturing import ratio. Regression analysis by New Harbor Consultants.
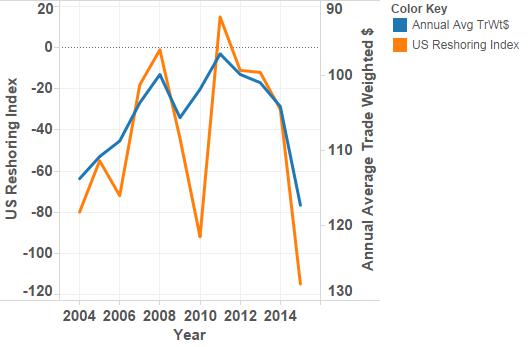
Comparing the inverted trade-weighted dollar index with the reshoring index in a single chart highlights the similarities in trends over the past dozen years (Figure 7). The one year that does not align well in this comparison is 2010, where using only the exchange rate would have yielded a more balanced reshoring index. However, the difference is accounted for by the US economy’s weak real growth in that year, which restrained imports of manufactured goods.
Figure 7. US Reshoring Index and trade-weighted US$ index
Sources: Trade weighted US Dollar Index: St Louis Fed: https://research.stlouisfed.org/fred2/series/TWEXB#
US Reshoring Index score, A.T. Kearney: US Reshoring: Over Before It Began?, Jan 2016. Index is year-over-year change in the manufacturing import ratio.
What, in turn, determines the trends in foreign exchange rates and economic growth? The value of the US dollar is largely related to relative investment prospects, such as interest rates, equity market returns, the economic growth outlook and governmental and societal stability. These factors have all been relatively strong in the US in recent years, especially since 2011. The dollar has slipped a bit (1.5%) during the first quarter of 2016. But the evidence of our regression analysis indicates that the dollar would have to fall significantly to reverse the net offshoring trend. On the US GDP front, current forecasts of about 2% real annual growth in 2016 and 2017 (not high but slightly above the average over the past decade), compared to challenging outlooks in some other countries, suggest that this second factor will also continue to favor net offshoring.
It is also true, at a deeper level, that the skids have now been greased for continued offshoring. US public policy shifted, several decades ago, to a view that services represented the most promising avenue of economic development. At the same time, the growth of manufacturing in China has led to extensive networks of industrial suppliers – an essential ingredient for future growth, which has been lost in the US for certain sectors. The long-term trend in offshoring is thus not likely to be reversed.
Future implications
These relationships support the view that the US will continue to source many of its manufactured goods from foreign origins for the foreseeable future. Examples of successful reshoring will continue, but will not outweigh the offshoring. Indeed, a recent study by MIT logisticians found that of 50 companies that had announced plans to move manufacturing back to the US, relatively few projects were actually implemented.4
What could significantly alter the course of this net offshoring trend? Possible scenarios could include such factors as:
- Unexpected major decline in the trade-weighted US dollar;
- New trade restrictions, as a backlash to perceived economic losses by the US middle class;
- Robotics-induced productivity gains or technological shifts (e.g., 3D printing) favoring US manufacturing;
- Reversal in the historical trend of declining US global competitiveness ranking5;
- Rising costs of doing business (not just wages but environmental measures and other restrictions) in China and other Asian nations; and
- Rising transpacific ocean and air freight rates, linked to higher (eventually) fuel costs.
Domestic manufacturing will remain strong in certain cases, such as bulky or heavy products that are made to order, including certain furniture; items containing sensitive intellectual property, such as robots; defense-oriented industries such as aerospace; and other items, e.g., those with unpredictable demand and short lead times. If the dollar weakens, look for additional reshoring opportunities. But a continued strong US dollar and GDP growth will favor net offshoring.
Notes and references
1 We define other Asian low-cost sourcing countries as: Bangladesh, Cambodia, India, Indonesia, Malaysia, Pakistan, Philippines, Sri Lanka, Thailand and Vietnam. See Note 3.
2 A.T. Kearney, U.S. Reshoring: Over Before It Began?, January 2016.
3 The A.T. Kearney research uses 14 Asian countries – the 10 low-cost nations noted above, China, plus Hong Kong, Singapore and Taiwan. From our perspective, we would no longer consider these latter three as primary offshoring destinations, so we exclude them in the container volume, GDP and Foreign Direct Investment charts.
4 Prof. Yossi Sheffi, Reviving the Reshoring Debate, LinkedIn post, January 14, 2016.
5 US global competitiveness dropped from first place in 2008 to third place in 2015, per the World Economic Forum’s Global Competitiveness Report, 2008-2015.
Contact us to explore how we can support your strategic, operational, and investment needs: info@newharborllc.com
David Bovet is the Managing Partner of New Harbor Consultants, a management consulting firm located near Boston. He focuses on helping clients translate their vision into practical results. David brings 30 years of experience across a range of industries, from manufacturing to transportation and financial services. Projects focus on strategic direction, market positioning, operational improvement and hands-on implementation.