
Ports and ocean carriers
April port import container volumes recovered somewhat from March but remained quite mixed. On the Pacific Coast, the Canadian ports shifted up to positive import comparisons versus the year-earlier month. The US ports improved from March but were still generally negative against the prior-year month, if one considers LA and LB together. Exports from US ports were still down in the 16-18% range versus prior year, except for Oakland which notched a small gain. The Canadian ports also saw mixed exports in April versus the prior year, though a much stronger performance than in March. Prince Rupert fared better than other Pacific Coast ports, albeit off a smaller volume base, with its service orientation including North China and Korea in addition to South China. On the Gulf and East Coasts, April import volumes were less negative than in March against the year-earlier month. This coincided with the recovery of Chinese manufacturing. Baltimore actually experienced a slight upswing in import TEUs. On the export side, all the Gulf and Atlantic ports we cover posted loaded volumes lower than in the year-earlier period, most in the 10-30% lower range.Port loaded TEUs, Feb-Apr 2020: Change vs prior year, %
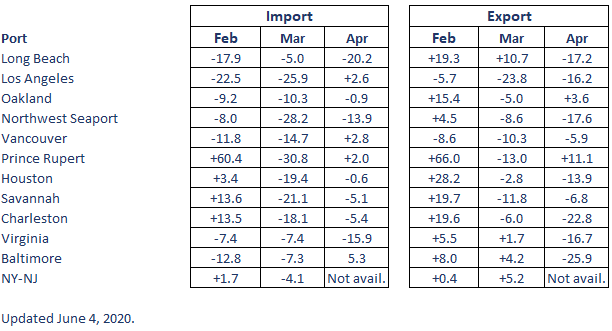
Source: New Harbor analysis of container data from selected North American ports.
Intermodal rail
The movement of containers by US railroads was down by 11.2% in the week ending May 23, and by 10.6% in the holiday-shortened week ended May 30, versus the prior-year weeks. From its nadir in mid-April, when volumes were down by 20% from the corresponding week a year earlier, this represents a significant and welcome turnaround.US intermodal rail trends, 2020 vs 2019 week
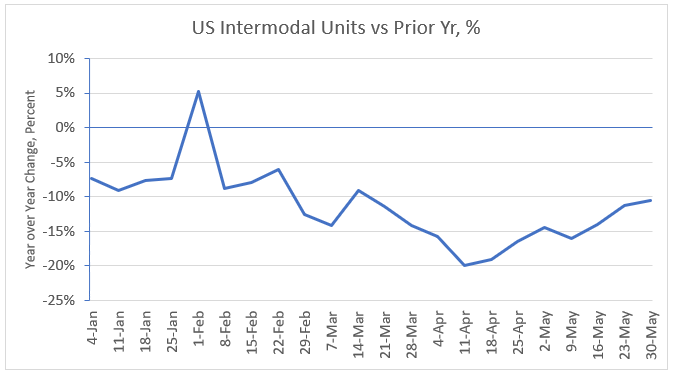
Source: AAR, Weekly Rail Traffic Data, intermodal units originated by week, weeks ending Jan-May 2020.
In addition, 15 of 20 carload commodity categories tracked by the AAR had higher loadings in the week ending May 23 than in the previous week. And on a year-over-year basis, improvements continued in the shortened week ending May 30. Carloads of motor vehicles and parts, for example, are still far below prior-year levels but were more than triple the number of units originated just three weeks earlier.
Trucking
Trucking activity is generally recovering, as of late May, from its lows in April. The situation also continues to vary substantially by region (see trucking activity map by Geotab below).US trucking activity by state, week of May 18-22, 2020
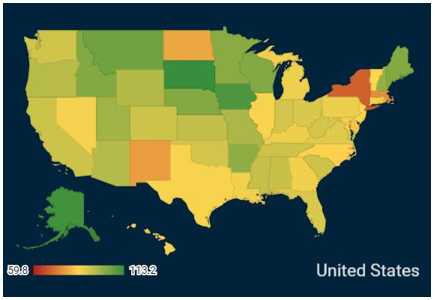
Source: Geotab, State of Recovery from COVID-19. Week of May 18-22, 2020. Baseline 100 = Feb 1-Mar 15, 2020.
- Northeast: NY down about 20%; MA down about 10%; rest of New England flat or up a bit
- Southeast: Generally flat or up slightly
- Midwest: Flat or up slightly
- South Central and Southwest: TX and LA flat, NM down slightly, other states up slightly
- Mountain: Up about 10% on average
- West Coast: Flat to slightly up
Supply chain de-risking
The coronavirus pandemic exposed vulnerability in many global supply chains. Companies now face an urgent opportunity to reconsider the balance between supply assurance and low cost. Now is the time, we believe, to de-risk the supply chain and raise resilience. Ten tactics for companies to consider are: Demand management:- Improve demand planning by sharing forecasts with distributors and retailers.
- Work with supply and logistics partners to create robust contingency plans.
- Diversify sourcing to reduce the risk of catastrophic supply chain failure.
- Localize to shorten the supply chain, including nearshoring production and postponement.
- Employ a major third-party logistics provider with broad resources to deal with crises.
- Build inventories strategically, modeling and optimizing stocks of critical components.
- Reduce complexity in the product line and bill of materials to reduce cost and grow revenues.
- Raise visibility along the extended supply chain, with real-time tracking of products and parts.
- Secure vital infrastructure and services, ranging from cybersecurity measures to electric supply.
- Monitor specific warning signs of trouble by tracking a limited set of supply chain risk indicators.
Longer-term trends
Import container tonnage surged ahead for US East Coast ports in 2019 while it fell on the West Coast. This is partly because such a high share of West Coast cargo volume comes from China – that trade lane was impacted by the tariff conflicts during the year. At the same time, ship sizes from Asia to the US East Coast ports have reached parity with those calling at West Coast ports, following the Panama Canal expansion. These factors have contributed to the continuing share gain of US East Coast versus West Coast ports. The balance stands at 45% for the Eastern ports in 2019, up from just 36% in 2010.Container port US coastal shares
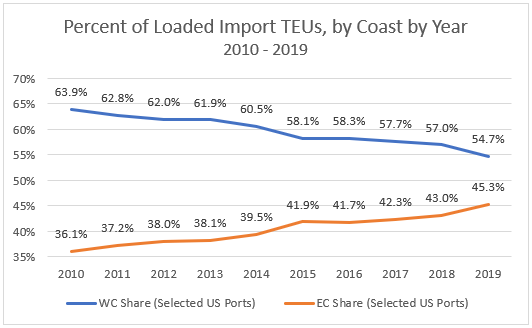
Source: New Harbor analysis of container data from 9 selected ports (LA, LB, Oakland, Seattle-Tacoma; Savannah, Charleston, Norfolk, Baltimore, New York-New Jersey).
US population growth by state, 2017-2018
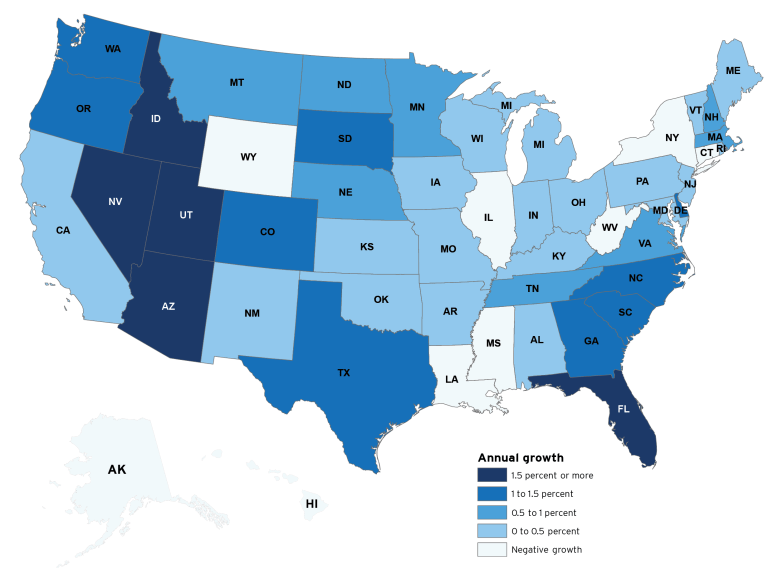
Note: Percent change over 12 months ending July 1, 2018.
Source: Brookings Institution, Metropolitan Policy Program; William H. Frey analysis of US Census Bureau population estimates, released Dec 19, 2018.
* * * * *
The fortunes of various port gateways are determined by a wide range of factors. We plan to explore other drivers of future US and Canadian container port traffic in future editions of these Ports & Intermodal Insights. Stay tuned for further updates.* * * * *
Contact us to explore how we can support your strategic, operational and investment needs: info@newharborllc.com. David Bovet is the Managing Partner at New Harbor Consultants. He focuses on helping clients translate their supply chain vision into practical results. David brings 30 years of experience across a range of industries and geographies. Projects focus on strategic direction, market positioning, operational improvement and hands-on implementation.