
You’ve probably seen the news – in 2023, Mexico became the top source of US imports on a dollar basis, beating out China for the first time since 2002 (Figure 1). Since the mid 2010’s, the gap between imports from China and those from Mexico and Canada has shrunk dramatically. Nearshoring — dominant prior to China joining the WTO — is once again a preferred sourcing strategy, surpassing offshoring to China. Let’s dig a little deeper into the data, how things are changing, and actions you can take.
Figure 1. US imports by origin, all commodities
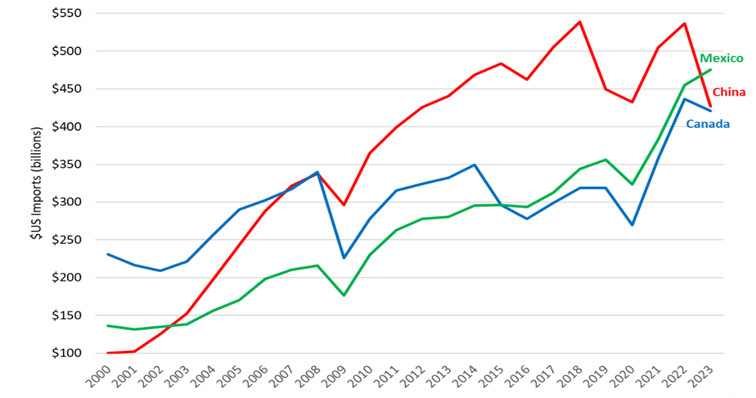
Source: US Trade Online (http://usatrade.census.gov/Perspective60).
Excluding non-manufactured goods (e.g., agricultural commodities, natural resources), Mexico also topped China – just barely – in 2023, with Canada falling to a distant third place (Figure 2). At the same time, imports of manufactured goods from both Mexico and China have grown significantly faster than US manufacturing output, reflecting the offshoring trend over most of the same period (Figure 3).
Figure 2. US imports by origin, mfd goods Figure 3. Imports vs. US mfd goods output
(indexed growth comparison, 2002 =100)
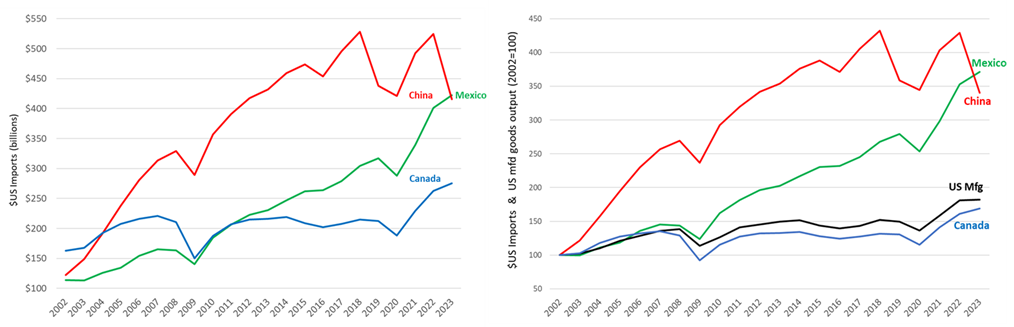
Note: Manufactured goods imports (customs value in USD) and US manufactured goods output (USD), current dollars, indexed to 2002 = 100.
Source: US Trade Online and U.S. Bureau of Economic Analysis (BEA).
While US imports from China have taken a hit, US global trade remains robust and offshore manufacturing in Asia and other regions continues. Imports are even accelerating from some countries and industry sectors. So, the challenge for supply chain professionals remains unchanged – making the best sourcing decisions whether it be offshoring, reshoring or nearshoring – and the job has gotten a bit more interesting.
In this Brief, we look underneath the headlines at a more granular level and suggest practical steps that companies and their logistics service providers can take to improve their sourcing decisions and global manufacturing and supplier networks.
Let’s start with a look at the numbers and some drivers behind changing trade flows and company global sourcing decisions. We will focus on manufactured goods[1] (87% of all 2023 US imports on a dollar basis), which excludes commodities, e.g., agricultural, oil, gas, and other natural resources.
Change – yet stability, too
The top five US import partners have remained consistent over the past 20 years: Mexico, China, Canada, Germany, and Japan (Figure 4). There have been significant shifts among the Top 5, however.
Figure 4. Top 5 partners, ranked by US import value (USD)
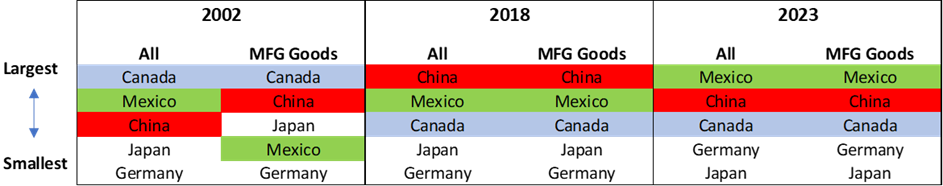
Source: US Trade Online.
These five countries alone represented 52% of total US imports (manufactured goods) in 2023, down from about 60% during 2009-2018 (Figure 5). This modest reduction in concentration reflects, in part, the burgeoning capabilities of Vietnam, India, and other developing nations. More about this later.
Figure 5. Cumulative US import shares: Slight diversification
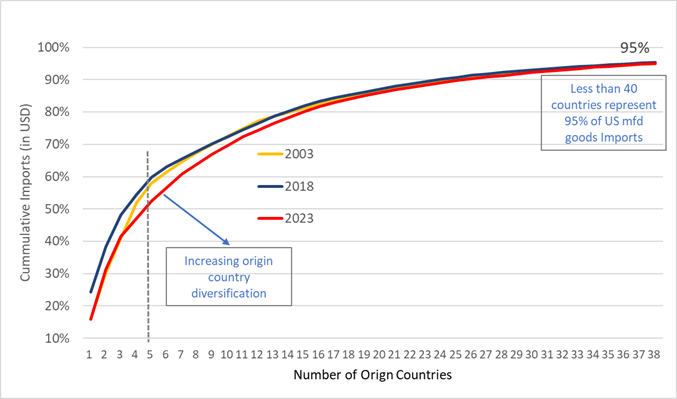
Source: US Trade Online and New Harbor analysis.
Canada has fallen to third place among the Top 5. Its manufactured goods shipments to the US have not even kept up with US manufacturing output (Figure 3). Canada’s relative trade strength has been in non-manufacturing sectors, namely energy, minerals, and ores. This is the opposite of Mexico – its non-manufacturing shipments to the US (most notably, natural resources) have fallen relative to manufactured goods. Almost all US imports from China, over the entire period, have been manufactured goods. Indeed, China became America’s, and the world’s, factory, following its accession to the World Trade Organization in 2001.
This import trade stability and recent modest diversification should not be surprising to sourcing professionals. Strategic supplier relationships are built on aligned goals, capabilities and value-added – much more than only cost. These relationships can also be long lasting. But supplier diversification is always prudent. When geopolitical relationships fracture or are at risk, greater and faster change is required. We are now seeing this most prominently with China.
North American reshoring
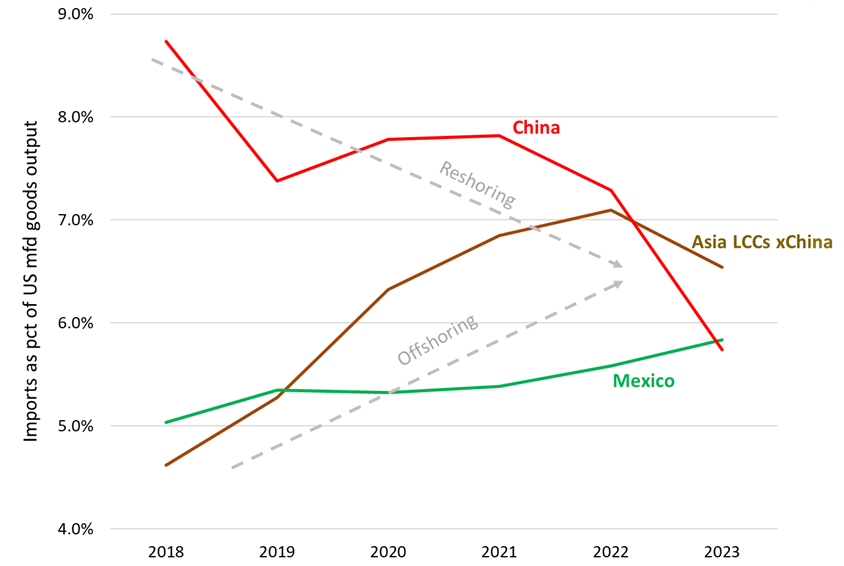
Call it reshoring, nearshoring, right-shoring, China + one, or just best-practice strategic sourcing: Since 2018, Chinese imports have fallen in comparison to US manufacturing output (Figure 6). After reaching a peak equivalent to almost 9% of US domestic manufacturing output in 2018, Chinese manufactured imports dropped to about 6% in 2023. Offshoring to Asian low-cost countries[2] (LCCs) as a whole peaked at 15%, three years later, in 2021.
US import duties on Chinese products (Section 301 tariffs[3]), which went into effect in 2018, certainly impacted company sourcing decisions. This is one reason to shift sourcing from China to other Asian LCCs or to reshore / nearshore to North America.
Figure 6. Offshoring, nearshoring, and reshoring trends, Mexico and China
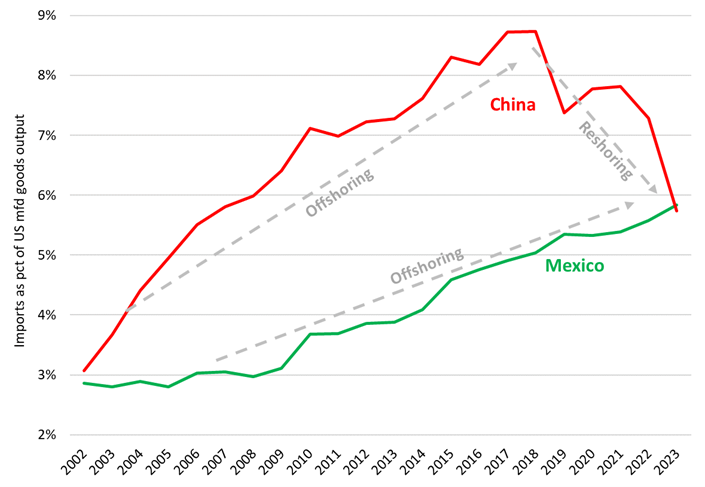
Source: US Trade Online and BEA.
Nearshoring to Mexico has clearly benefited. Proximity to the US market; improved manufacturing and supply chain capabilities, competitive labor costs, productivity, and logistics cost; plus trade agreements[4] increasingly drive manufactured goods sourcing to Mexico. Best-practice sourcing decisions, whether on a global or local scale, reflect these factors and are embedded in the total cost of ownership (TCO) metric. For sure, supply chain risk, whether geopolitical or logistics-related, has played to Mexico’s advantage.
Foreign direct investment (FDI) is also a strong tailwind for Mexico, hitting an all-time high in 2023, partly reflecting the attractiveness of nearshoring, while global FDI in China has taken a hit (Figure 7), falling to a 30-year low last year.
Figure 7. FDI in China and Mexico, from all origins
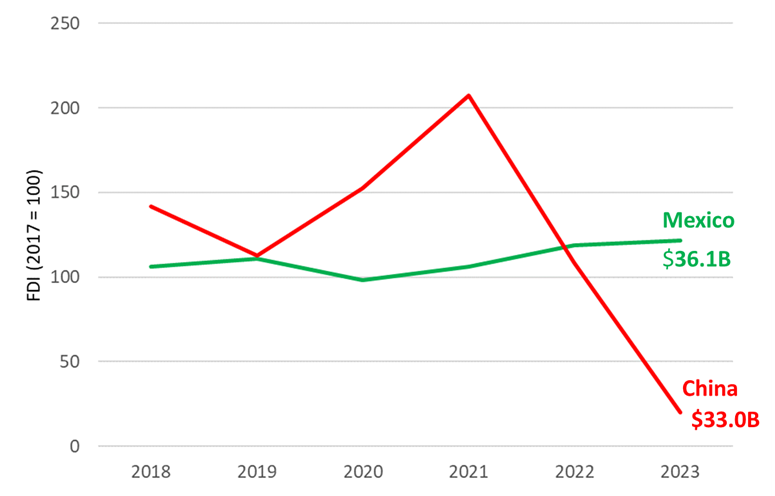
Source: World Bank, China Economic Review, and Mexico Ministry of Economy.
China’s presence next door
Chinese manufacturers also understand the benefits of serving the US market via Mexico. Not surprisingly, Chinese companies have accelerated their investments and operations in Mexico recently (Figure 8), although Chinese FDI in Mexico fell in 2023 based on preliminary data. BYD, for example, the Chinese manufacturer of EVs, recently announced plans to expand into Mexico. It’s believed the goal will be to export from there to the US, bypassing Section 301 tariffs. Chinese auto parts suppliers and other manufacturers have already established or announced new factories in Mexico, reflecting the growth in Mexican nearshoring and the local content rules under the USMCA[5].
Chinese shipments to Mexico are also up in recent years (Figure 9), in part to supply companies that have shifted their China- or Asian LCC-based manufacturing to Mexico. These relocated operations may still be largely dependent on China-based suppliers and networks of overseas sub-suppliers.
Figure 8. Chinese FDI in Mexico Figure 9. Chinese exports to Mexico
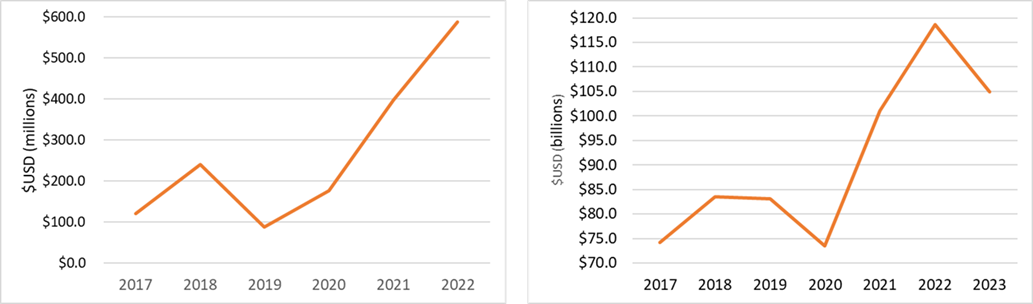
Source: Data Mexico (https://www.economia.gob.mx/datamexico).
China – down but not out?
Weak economic conditions in China – slowing growth, falling prices, low consumer confidence, high youth unemployment – combined with its historically export-driven economy and large investments in domestic manufacturing could drive a rebound in Chinese exports to the US and globally. This may reflect bargain hunting, as well as the competitive advantage of its investments in targeted industrial sectors.
Recently-released US import data shows a 7% YoY decline in January for China imports, indicating continued challenges, though not as bad as the 21% drop for all of 2023. Mexican exports to the US, on the other hand, were up modestly in January.
Nearshoring in Mexico spans industry sectors
Manufacturing or sourcing goods in Mexico for the US market has continued to grow in recent years, extending a strong 20-year trend across a wide swath of industries. All five of Mexico’s largest industries exporting to the US (80% of its US exports) grew faster than comparable US manufacturing output (Figure 10), though only slightly so in the computer and electronics sector.
Figure 10: Nearshoring in Mexico
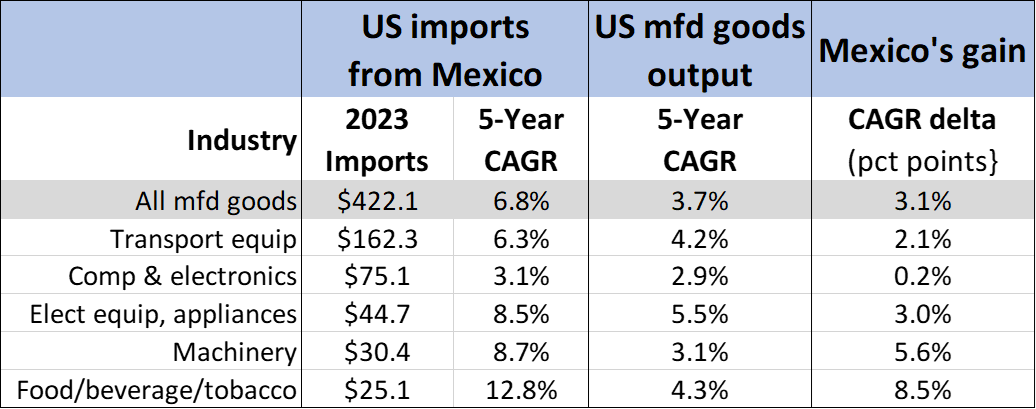
Note: Total and Top 5 industries. Sectors defined by 3-digit NAICS codes. Source: US Trade Online and BEA.
Competitive resiliency in Asia
Don’t discount the rest of Asia. The Asia LLCs, excluding China, have done well over the past five years versus both China and Mexico, despite a slight downtick in 2023, demonstrating their continued strength as offshore suppliers to the US market (Figure 11).
Figure 11. Asia LCCs, China, and Mexico Sourcing, 2018 to 2023
Source: US Trade Online and BEA.
Two industry sectors in Asia showed particular US import resiliency: 1) electrical equipment and appliances and 2) computer and electronics (Figure 12).
Excluding China, electrical and appliances was a bright spot for sourcing in Asia, the only major industry sector with a positive uptick in 2023 and resilient 5-year offshoring growth. Vietnam, Thailand, and India grew strongly and even China’s 2023 US exports decline in the sector (-8%) was substantially less than its overall imports decline (-21%).
Figure 12. Competitive resiliency in Asia
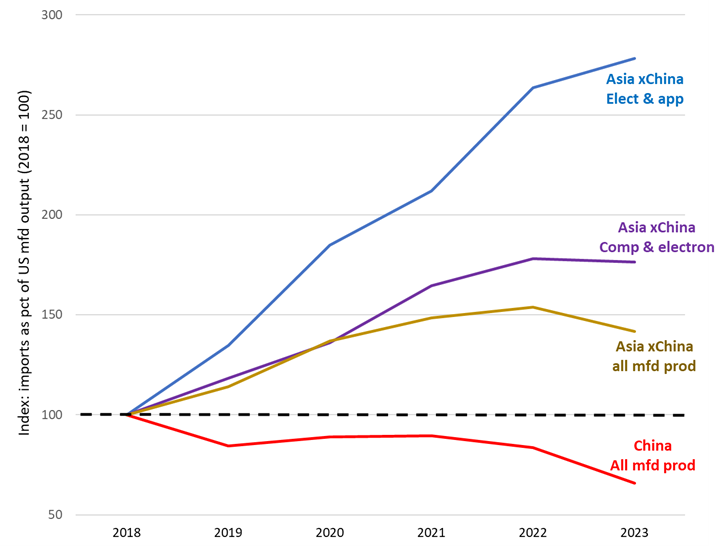
Source: US Trade Online and BEA.
Nearly 60% of Taiwan exports to the US are computer and electronics-related products whose nominal dollar value increased by double digits in 2023 and grew on average 24% per year over the past five years. US imports of computer products from India and Indonesia also increased sharply in 2023, albeit on a much smaller base. And Vietnam and Thailand only experienced modest declines in 2023, maintaining robust 5-year growth trends.
All these origins appear to be benefiting to some extent from the large decline in exports from China. Chinese companies are expanding in these countries as well. Chinese FDI in Southeast Asia increased by 2.6x from 2017 to 2022, to $8.21B[6]. While Chinese investment in Southeast Asia is significantly larger than in Mexico, its Mexican FDI has been growing faster (see Figure 8).
Jason Furniture, a Chinese company, is an example of these migrating overseas investments. The company first expanded to Vietnam in 2019 to offset US tariffs on China-origin imports and then also established production operations in Mexico[7].
While Apple continues to manufacture the majority of iPhones in China, the company first moved some production to India in 2017 as it sought to diversify its supply chain. It now plans to shift as much as 25% of iPhone production to India by the end of the decade. Foxconn, Apple’s contract manufacturing partner, its suppliers, and others are establishing or expanding operations in India, with support from government incentives for hi-tech and EV manufacturers. Other US high-tech companies are asking their suppliers to increase manufacturing in Mexico, to reduce reliance on China[8].
The takeaway here is that while nearshoring is picking up speed, some competitive advantages – across sectors, countries, and regions – can be sticky and not easily replicated in North America, nor would it necessarily be desirable to do so in every case. Seek your sweet spot.
Other offshoring regions – Eastern Europe and Brazil
Eastern Europe deserves some consideration. While still small ($45B in 2023, one-tenth the size of US imports from Mexico), the region’s US shipments have grown consistently and accelerated in recent years (Figure 13). It is also a nearshoring region for Europe and the Middle East.
Figure 13: US offshoring growth in Eastern Europe vs Mexico
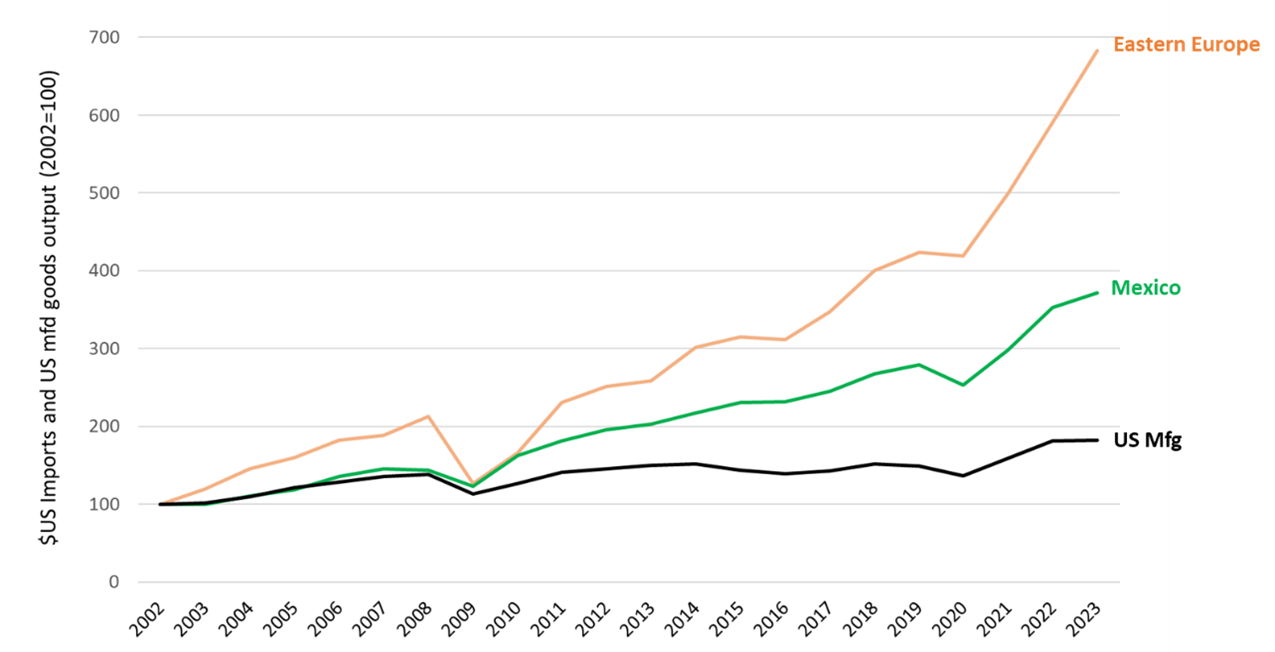
Note: Eastern Europe defined as: Belarus, Bulgaria, the Czech Republic, Hungary, Moldova, Poland, Romania, Slovakia, and Ukraine.
Source: US Trade Online and BEA.
Poland is the region’s largest exporter to the US, with an export profile by industry similar to Mexico. Intel, a long timer in Poland, is investing $4.6B in a new semiconductor assembly plant there, citing the country’s infrastructure, strong talent base, and business-friendly environment. China, on the other hand, has become less friendly to US tech companies.
Closer to home, Brazil offers a few bright sourcing spots for the US market, particularly for manufactured food products. This sector and the other two of its top US export industries, primary metals and machinery, have grown recently relative to US manufactured goods output.
Brazil is still a small US import origin for manufactured goods, $28B in 2023, similar in size to Singapore. Brazil has struggled recently to maintain manufacturing competitiveness – high costs and low profits are exacerbated by business-unfriendly policies. This has led to factory shutdowns and departures of automotive, high-tech, and other high value-added manufacturing companies, including Audi, Ford, Eli Lilly, Sony and others[9]. That said, the government is seeking reforms to revive manufacturing, so it’s good to keep on the lookout for sourcing opportunities there.
Takeaways for supply chain professionals
While China flows are down, opportunities abound for low-cost country nearshoring (e.g., Mexico) and offshoring (Asia and elsewhere), based on US import trends. Given this global environment, we suggest five ways that companies can reassess sourcing strategies and suppliers:
- Keep current with your supply chain risk assessments
We find the Boards of small- and medium-sized companies increasingly asking for supply chain risk assessments. Concerns may initially be with China – IC protection, supply continuity, tariffs, logistics costs, and lead times – but China is not the only risk.
Even Mexico-based nearshoring is not risk free. A deep dive into your suppliers’ supply chain may reveal a highly Asia- or China-dependent supply base. Or a single-sourced strategic component. The goal is to understand the greatest risks and potential impacts, then develop mitigation actions. These may include adding a second supplier or shifting some supply to an alternative region. - Focus on total cost of ownership
Sourcing decisions are based on cost/benefit-based business cases. The focus is on including and quantifying relevant costs, such as product, logistics, duties, inventory, compliance, quality, and aftersales support. Product design and development costs may also be tied to your sourcing decision.
With nearshoring, whether it be in Mexico for the North American market or in Poland for the broader European and nearby Middle Eastern markets, logistics cost and lead time advantages are typically more readily assessable. Finding and qualifying suppliers may be a bigger challenge, impacting the pace of change and the timing of financial benefits. Be sure to leverage your contract manufacturers’ and logistics service providers’ capabilities. - Segment and prioritize products and suppliers
Focus first on the most strategic materials and those with the highest spend. And be sure to include your supplier’s exposure to China as well. China is not out. It remains a manufacturing powerhouse and there will be opportunities worth evaluating, but heightened due diligence is warranted. - Measure and manage supplier performance
We see more small- and mid-sized companies seeking to improve their supplier and supply chain performance management capabilities. Supplier scorecards and top-to-top quarterly business reviews with the most critical suppliers are not just for large companies. Your logistics partners can often provide valuable assistance, and can offer helpful expertise in international markets. - Assess and build your sourcing expertise
Growing the right talent in your organization is essential to supply chain excellence – as global trade opportunities and risks abound. It is that unique combination of analytical and people skills, with cross-cultural nimbleness, that defines the strongest performers in supply chain management.
A rapid sourcing diagnostic is a practical launching point – initially targeting the most strategic products, highest spends, and known supplier relationship risks. For many companies, rethinking China-based sourcing (including Tier 1 and 2 suppliers) is high on the agenda. For small- and medium-sized businesses, a four-to-six-week diagnostic project can target quick wins and set the priorities and actions for subsequent work. Outcomes span strategy, process, people, and systems.
Mexican imports beat out Chinese last year, but global sourcing in China and elsewhere overseas remains strong. Keep close to the risks, costs, your suppliers, and the opportunities.
* * * * *
Contact us to explore how we can support your strategic, operational, and investment needs: info@newharborllc.com.
David Frentzel is a Partner at New Harbor Consultants. Dave brings 30 years of management consulting and hands-on executive leadership experience to improve business outcomes. Prior to joining New Harbor, he held various senior positions at 3PL and supply chain technology companies. Dave has extensive global management expertise helping companies with their go-to-market, organizational, sourcing, manufacturing and supply chain strategies and operations.
[1] NAICS codes 31-33. The Manufacturing sector comprises establishments engaged in the mechanical, physical, or chemical transformation of materials, substances, or components into new products. See: https://www.naics.com.
[2] Asian LCCs include Bangladesh, Cambodia, China, Hong Kong, Philippines, Malaysia, India, Indonesia, Pakistan, Singapore, Sri Lanka, Taiwan, and Vietnam.
[3] See https://ustr.gov/issue-areas/enforcement/section-301-investigations/search.
[4] The United States-Mexico-Canada Agreement (USMCA) replaced the North America Free Trade Agreement (NAFTA) as of July, 2020. See https://ustr.gov/trade-agreements/free-trade-agreements/united-states-mexico-canada-agreement.
[5] The Economist, “Why Chinese companies are flocking to Mexico,” November 23, 2023; Wall Street Journal, “To Avoid Hefty Tariffs, China’s BYD Eyes U.S. Car Market Via Mexico,” February 19, 2024.
[6] CEIC
[7] Wall Street Journal, “U.S. Companies Are Finding It Hard to Avoid China,” December 12, 2023.
[8] Wall Street Journal, “U.S. Tech Giants Turn to Mexico to Make AI Gear, Spurning China,” March 31, 2024.
[9] Wall Street Journal, “A Factory Exodus Is Hollowing Out Brazil’s Industrial Heartland,” June 8, 2023.